Earth Dashboard
Making the world visible through interactive data visualizations
Why We Need an Earth Dashboard
The world has a critical need to see itself as one interconnected whole rather than disparate countries, cities, tribes, cultures, religions or special interests. Without this unitary view of intertwined fates, the parochial trumps the planetary, narrow self-interest bests enlightened self-interest, greed beats generosity — and the world is endangered through short-term and near-sighted thinking and actions.
Because of the interconnections of science, technology, economy, culture, environment, problems and options — and the intertwined fate of all life on board “Spaceship Earth,” there is a critical need for a tool similar in purpose and function to a vehicle’s dashboard.
The Vehicle Metaphor
Dashboard
Describes the present state of the vehicle — speed, fuel, temperature. The Earth Dashboard shows the current condition of our planet in real-time.
Windshield
The view of the immediate future — where the vehicle is heading. Shows the problems confronting humanity and our desired destinations and goals.
Rearview mirror
A view into the past — where we have been. Trends of vital statistics going back as far as reliable data is available.
The Helm: Taking Action
The helm is where a ship is steered from. The helm for Spaceship Earth is where global and local problems are solved and strategic design and planning are done. As such, it is where we can take corrective action to steer our world away from danger and towards the destinations we choose.
The helm is where the EarthGame/NewWorld Game takes place — where problems are encountered and assessed, options examined, new solutions developed, destinations determined and actions taken that avert disasters, reach goals, and meet needs.
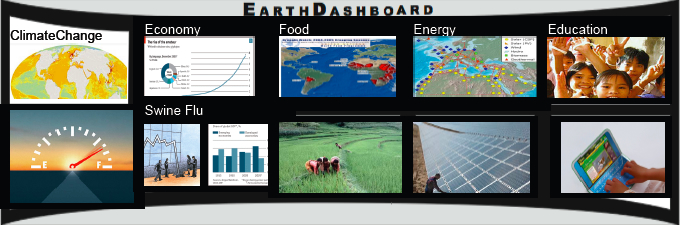
Earth Dashboard
One version of the Earth Dashboard is being designed for highly visible locations throughout the world. It will be both a dashboard for the Earth and a dashboard for the local region. It will be a place where people will see what is happening right now on the planet and their home region.
This will be done through a series of live, real time meters, gauges, trends, maps, maps in time series, viability thermometers and alarms (among many other data visualization techniques) that transform global facts and figures, the UN Sustainable Development Goal indicators and little know but critically important data into understandable visualizations. These data sets will be supplemented with live feeds from web cams, satellite images and other sources.
Dashboard Features
Real-time Data Visualization
Live meters, gauges, maps, and alarms providing an accurate present state condition of Earth
Interactive Exploration
Ability to zoom from whole Earth to local levels, showing links between scales
UN SDG Indicators
Transformation of UN Sustainable Development Goal indicators into understandable visualizations
Multiple data sources
Integration of web cams, satellite images, and diverse global data sources
The Power of Visibility
If the world had such a dashboard, and this dashboard was available in a highly visible and credible public (and web) location where all could get access and see it, the dashboard would function as a critical source of global visualization.
Those viewing the dashboard will come away with an increased and more tangible sense of the whole world, its interrelations, problems, and options. If this dashboard is interactive and involves the viewer, its power and impact will be even greater.
Mission Statement
Making the world visible — Interactive data visualizations of key global indicators: increasing transparency, understanding and informed action.